Thursday, October 2, 2014

Dow Jones Industrial 30


Dow Jones Industrial

Above chart shows -ve divergence (rsi).in above chart trend-line is supporting a major advance. if DJIA break such trend-line than we might see lower levels up to  15300 even less.

> Click on chart to enlarge it <

more update soon. 

Wednesday, September 17, 2014

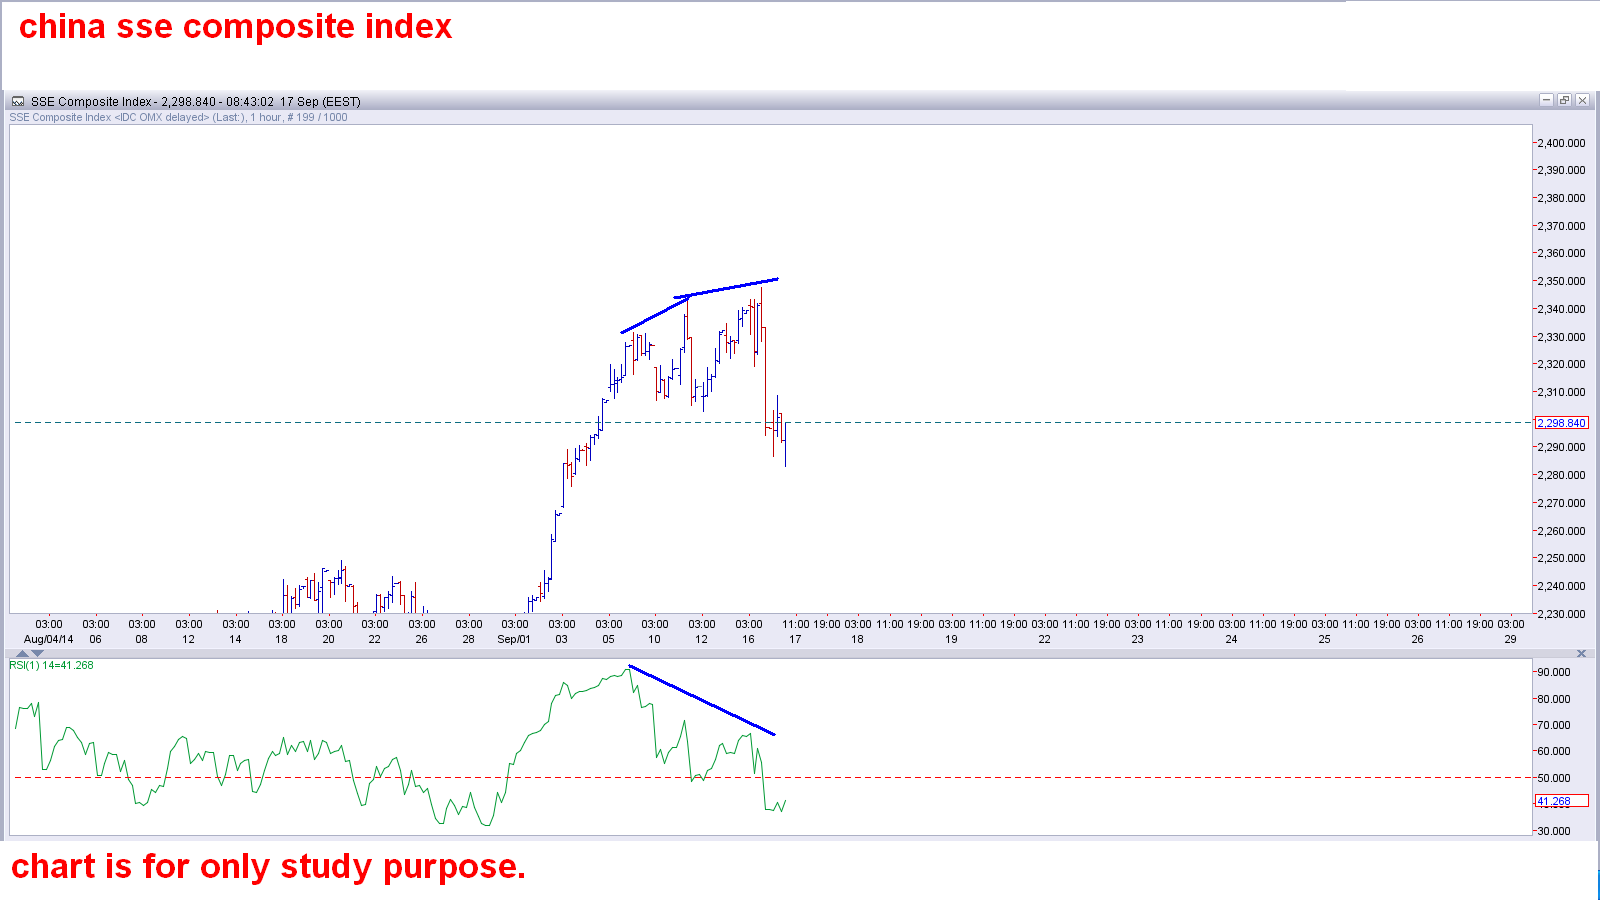
china temporarily stop of bull ???

china index

china index, sse composite index -ve divergence which indicate decline.

Monday, September 15, 2014

Gold triangle break more decline, and what more decline means 1000$ or end of trend ? ? ?

GOLD
#gold triangle break will trade in decline, gold may touch 1000 $ mark in coming days...
gold more selling pressure will be seen in continuous trade.

more update soon stay connected with this blog for more exciting update...

Sunday, September 14, 2014

Nifty strength less or power pack ???

Advance/Decline
                                                                                                                  Data courtesy: icharts.in

Advance - decline line tells the clear picture ahead,less number of advance creating weak strength.
advance - decline line always shows great strength about market.
above chart clear your next trade with the help of a/d line.